Hi
Nach dem letzten Update habe ich Performance Probleme siehe Bild und im Vergleich ein anderer virtueller Server. 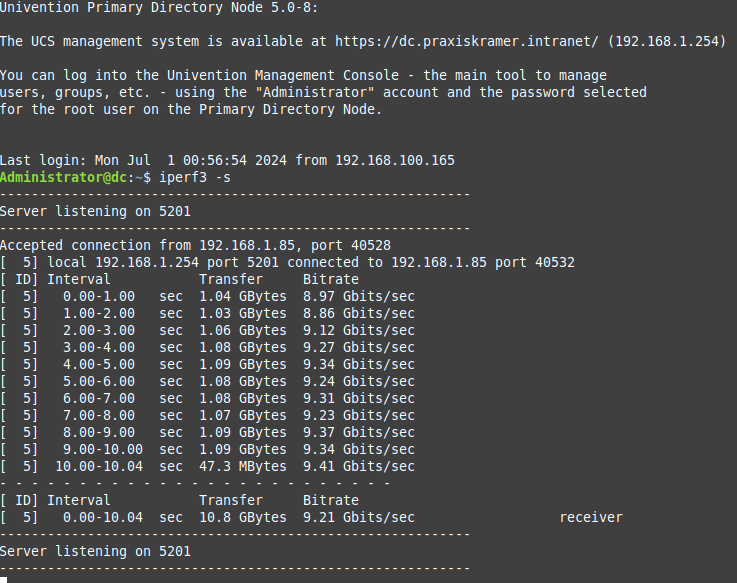
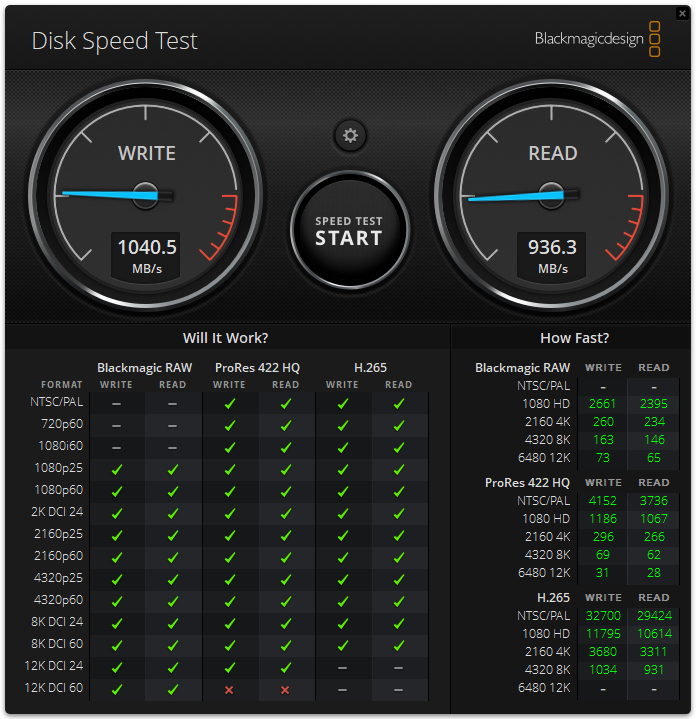
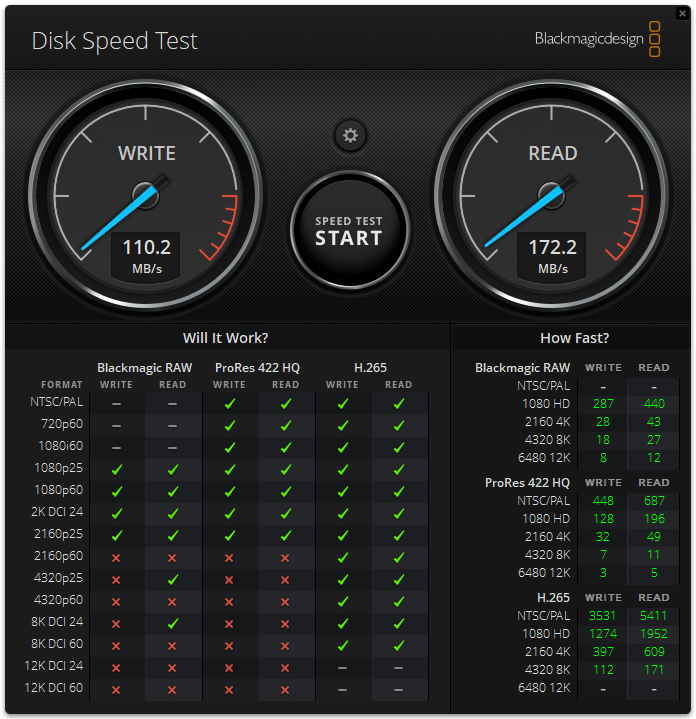

Hi
Nach dem letzten Update habe ich Performance Probleme siehe Bild und im Vergleich ein anderer virtueller Server.
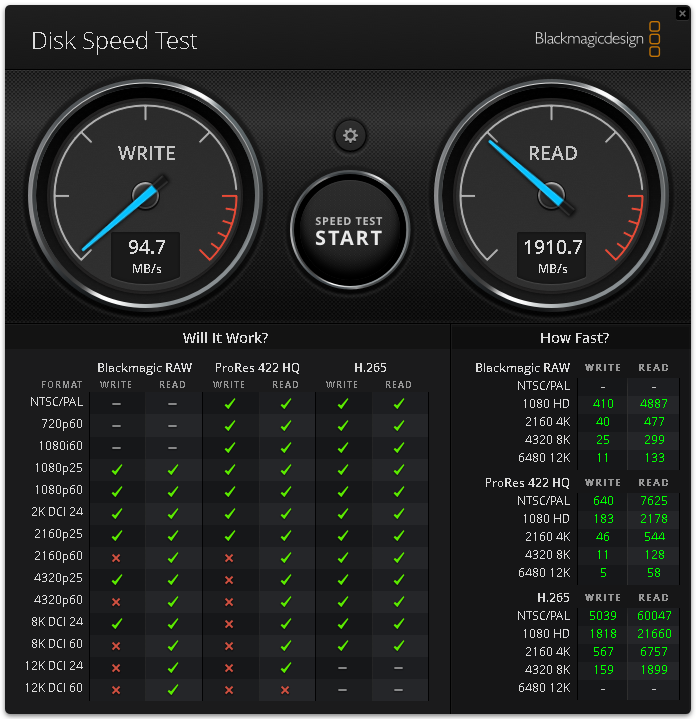
Eine deutlich bessere Leseperformance bekomme ich wenn ich in Windows 11 den share via NFS-client hinzufüge = siehe Bild
Read Speed Test direkt in der VM UCS (auf Proxmox, 8.2, zfs, nvme)
fio --filename=/tmp/test.bin --direct=1 --rw=read --ioengine=libaio --bs=2m --iodepth=64 --size=10G --numjobs=1 --runtime=60 --time_base=1 --group_reporting --name=test-seq-read
test-seq-read: (g=0): rw=read, bs=(R) 2048KiB-2048KiB, (W) 2048KiB-2048KiB, (T) 2048KiB-2048KiB, ioengine=libaio, iodepth=64
fio-3.12
Starting 1 process
Jobs: 1 (f=1): [R(1)][100.0%][r=5870MiB/s][r=2935 IOPS][eta 00m:00s]
test-seq-read: (groupid=0, jobs=1): err= 0: pid=11312: Mon Jul  1 19:17:06 2024
  read: IOPS=2763, BW=5528MiB/s (5796MB/s)(324GiB/60026msec)
    slat (usec): min=24, max=6334, avg=65.35, stdev=72.94
    clat (usec): min=1154, max=253241, avg=23085.32, stdev=12887.98
     lat (usec): min=1211, max=253302, avg=23151.21, stdev=12884.99
    clat percentiles (msec):
     |  1.00th=[    5],  5.00th=[    9], 10.00th=[   12], 20.00th=[   16],
     | 30.00th=[   18], 40.00th=[   19], 50.00th=[   21], 60.00th=[   22],
     | 70.00th=[   25], 80.00th=[   30], 90.00th=[   38], 95.00th=[   45],
     | 99.00th=[   70], 99.50th=[   81], 99.90th=[  142], 99.95th=[  171],
     | 99.99th=[  236]
   bw (  MiB/s): min=  948, max= 6132, per=99.98%, avg=5526.65, stdev=1017.99, samples=120
   iops        : min=  474, max= 3066, avg=2763.29, stdev=508.99, samples=120
  lat (msec)   : 2=0.01%, 4=0.44%, 10=6.23%, 20=42.86%, 50=47.28%
  lat (msec)   : 100=2.94%, 250=0.24%, 500=0.01%
  cpu          : usr=1.94%, sys=20.84%, ctx=69570, majf=0, minf=74
  IO depths    : 1=0.1%, 2=0.1%, 4=0.1%, 8=0.1%, 16=0.1%, 32=0.1%, >=64=100.0%
     submit    : 0=0.0%, 4=100.0%, 8=0.0%, 16=0.0%, 32=0.0%, 64=0.0%, >=64=0.0%
     complete  : 0=0.0%, 4=100.0%, 8=0.0%, 16=0.0%, 32=0.0%, 64=0.1%, >=64=0.0%
     issued rwts: total=165897,0,0,0 short=0,0,0,0 dropped=0,0,0,0
     latency   : target=0, window=0, percentile=100.00%, depth=64

Run status group 0 (all jobs):
   READ: bw=5528MiB/s (5796MB/s), 5528MiB/s-5528MiB/s (5796MB/s-5796MB/s), io=324GiB (348GB), run=60026-60026msec

Disk stats (read/write):
    dm-0: ios=331181/613, merge=0/0, ticks=7542300/708980, in_queue=7587784, util=100.00%, aggrios=331860/441, aggrmerge=4/179, aggrticks=7578059/428555, aggrin_queue=7588456, aggrutil=99.92%
  vda: ios=331860/441, merge=4/179, ticks=7578059/428555, in_queue=7588456, util=99.92%
Read Speed Test direkt in der VM Ubuntu (auf Proxmox, 8.2, zfs, nvme)
fio --filename=/tmp/test.bin --direct=1 --rw=read --ioengine=libaio --bs=2m --iodepth=64 --size=10G --numjobs=1 --runtime=60 --time_base=1 --group_reporting --name=test-seq-read
test-seq-read: (g=0): rw=read, bs=(R) 2048KiB-2048KiB, (W) 2048KiB-2048KiB, (T) 2048KiB-2048KiB, ioengine=libaio, iodepth=64
fio-3.28
Starting 1 process
Jobs: 1 (f=1): [R(1)][100.0%][r=6200MiB/s][r=3100 IOPS][eta 00m:00s]
test-seq-read: (groupid=0, jobs=1): err= 0: pid=2607599: Mon Jul  1 19:26:00 2024
  read: IOPS=3589, BW=7178MiB/s (7527MB/s)(421GiB/60015msec)
    slat (usec): min=22, max=12670, avg=72.77, stdev=90.65
    clat (usec): min=1127, max=55629, avg=17752.56, stdev=6979.56
     lat (usec): min=1228, max=55689, avg=17825.89, stdev=6976.59
    clat percentiles (usec):
     |  1.00th=[ 3392],  5.00th=[ 7111], 10.00th=[10421], 20.00th=[12125],
     | 30.00th=[13304], 40.00th=[15008], 50.00th=[17433], 60.00th=[19530],
     | 70.00th=[20841], 80.00th=[22414], 90.00th=[25822], 95.00th=[30540],
     | 99.00th=[39060], 99.50th=[41157], 99.90th=[45876], 99.95th=[47449],
     | 99.99th=[52167]
   bw (  MiB/s): min= 5492, max=10180, per=100.00%, avg=7186.65, stdev=1225.05, samples=119
   iops        : min= 2746, max= 5090, avg=3593.26, stdev=612.54, samples=119
  lat (msec)   : 2=0.16%, 4=1.51%, 10=7.52%, 20=53.95%, 50=36.83%
  lat (msec)   : 100=0.02%
  cpu          : usr=3.47%, sys=30.32%, ctx=103727, majf=0, minf=32783
  IO depths    : 1=0.1%, 2=0.1%, 4=0.1%, 8=0.1%, 16=0.1%, 32=0.1%, >=64=100.0%
     submit    : 0=0.0%, 4=100.0%, 8=0.0%, 16=0.0%, 32=0.0%, 64=0.0%, >=64=0.0%
     complete  : 0=0.0%, 4=100.0%, 8=0.0%, 16=0.0%, 32=0.0%, 64=0.1%, >=64=0.0%
     issued rwts: total=215396,0,0,0 short=0,0,0,0 dropped=0,0,0,0
     latency   : target=0, window=0, percentile=100.00%, depth=64

Run status group 0 (all jobs):
   READ: bw=7178MiB/s (7527MB/s), 7178MiB/s-7178MiB/s (7527MB/s-7527MB/s), io=421GiB (452GB), run=60015-60015msec

Disk stats (read/write):
    dm-0: ios=264229/835, merge=0/0, ticks=4575148/6536, in_queue=4581684, util=99.98%, aggrios=465876/460, aggrmerge=28206/375, aggrticks=8099076/3296, aggrin_queue=8103484, aggrutil=99.90%
  vda: ios=465876/460, merge=28206/375, ticks=8099076/3296, in_queue=8103484, util=99.90%
Write Speed Test direkt in der VM UCS (auf Proxmox, 8.2, zfs, nvme)
fio --filename=/tmp/test.bin  --direct=1 --rw=write --ioengine=libaio --bs=2m --iodepth=64 --size=10G --numjobs=1 --runtime=60 --time_base=1 --group_reporting --name=test-seq-write
test-seq-write: (g=0): rw=write, bs=(R) 2048KiB-2048KiB, (W) 2048KiB-2048KiB, (T) 2048KiB-2048KiB, ioengine=libaio, iodepth=64
fio-3.12
Starting 1 process
test-seq-write: Laying out IO file (1 file / 10240MiB)
Jobs: 1 (f=1): [W(1)][100.0%][w=484MiB/s][w=242 IOPS][eta 00m:00s]
test-seq-write: (groupid=0, jobs=1): err= 0: pid=10544: Mon Jul  1 19:13:56 2024
  write: IOPS=711, BW=1422MiB/s (1491MB/s)(83.7GiB/60272msec); 0 zone resets
    slat (usec): min=38, max=78528, avg=199.72, stdev=831.81
    clat (usec): min=1581, max=702427, avg=89781.33, stdev=78760.29
     lat (usec): min=1708, max=702510, avg=89981.66, stdev=78721.19
    clat percentiles (msec):
     |  1.00th=[    8],  5.00th=[   15], 10.00th=[   22], 20.00th=[   34],
     | 30.00th=[   45], 40.00th=[   55], 50.00th=[   68], 60.00th=[   80],
     | 70.00th=[   94], 80.00th=[  125], 90.00th=[  205], 95.00th=[  262],
     | 99.00th=[  368], 99.50th=[  414], 99.90th=[  567], 99.95th=[  600],
     | 99.99th=[  684]
   bw (  MiB/s): min=  336, max= 6120, per=99.98%, avg=1421.99, stdev=983.06, samples=120
   iops        : min=  168, max= 3060, avg=710.94, stdev=491.53, samples=120
  lat (msec)   : 2=0.01%, 4=0.17%, 10=2.02%, 20=6.62%, 50=26.81%
  lat (msec)   : 100=37.76%, 250=20.82%, 500=5.61%, 750=0.18%
  cpu          : usr=8.27%, sys=7.02%, ctx=24093, majf=0, minf=11
  IO depths    : 1=0.1%, 2=0.1%, 4=0.1%, 8=0.1%, 16=0.1%, 32=0.1%, >=64=99.9%
     submit    : 0=0.0%, 4=100.0%, 8=0.0%, 16=0.0%, 32=0.0%, 64=0.0%, >=64=0.0%
     complete  : 0=0.0%, 4=100.0%, 8=0.0%, 16=0.0%, 32=0.0%, 64=0.1%, >=64=0.0%
     issued rwts: total=0,42860,0,0 short=0,0,0,0 dropped=0,0,0,0
     latency   : target=0, window=0, percentile=100.00%, depth=64

Run status group 0 (all jobs):
  WRITE: bw=1422MiB/s (1491MB/s), 1422MiB/s-1422MiB/s (1491MB/s-1491MB/s), io=83.7GiB (89.9GB), run=60272-60272msec

Disk stats (read/write):
    dm-0: ios=0/86057, merge=0/0, ticks=0/7563688, in_queue=7634328, util=99.91%, aggrios=0/85807, aggrmerge=0/248, aggrticks=0/7585102, aggrin_queue=7564540, aggrutil=99.68%
  vda: ios=0/85807, merge=0/248, ticks=0/7585102, in_queue=7564540, util=99.68%
Write Speed Test direkt in der VM ubuntu (auf Proxmox, 8.2, zfs, nvme)
fio --filename=/tmp/test.bin  --direct=1 --rw=write --ioengine=libaio --bs=2m --iodepth=64 --size=10G --numjobs=1 --runtime=60 --time_base=1 --group_reporting --name=test-seq-write
test-seq-write: (g=0): rw=write, bs=(R) 2048KiB-2048KiB, (W) 2048KiB-2048KiB, (T) 2048KiB-2048KiB, ioengine=libaio, iodepth=64
fio-3.28
Starting 1 process
Jobs: 1 (f=1): [W(1)][100.0%][w=1544MiB/s][w=771 IOPS][eta 00m:00s]
test-seq-write: (groupid=0, jobs=1): err= 0: pid=2616190: Mon Jul  1 19:35:32 2024
  write: IOPS=944, BW=1890MiB/s (1982MB/s)(111GiB/60077msec); 0 zone resets
    slat (usec): min=36, max=50176, avg=256.18, stdev=764.18
    clat (usec): min=1425, max=305681, avg=67459.36, stdev=32717.37
     lat (usec): min=1544, max=305889, avg=67716.42, stdev=32679.00
    clat percentiles (msec):
     |  1.00th=[   10],  5.00th=[   18], 10.00th=[   27], 20.00th=[   40],
     | 30.00th=[   50], 40.00th=[   59], 50.00th=[   67], 60.00th=[   77],
     | 70.00th=[   82], 80.00th=[   88], 90.00th=[  107], 95.00th=[  125],
     | 99.00th=[  165], 99.50th=[  190], 99.90th=[  255], 99.95th=[  288],
     | 99.99th=[  296]
   bw (  MiB/s): min= 1032, max= 7292, per=100.00%, avg=1893.62, stdev=667.39, samples=119
   iops        : min=  516, max= 3646, avg=946.63, stdev=333.66, samples=119
  lat (msec)   : 2=0.02%, 4=0.05%, 10=1.20%, 20=5.03%, 50=24.76%
  lat (msec)   : 100=56.76%, 250=12.07%, 500=0.11%
  cpu          : usr=12.15%, sys=12.22%, ctx=34715, majf=0, minf=12
  IO depths    : 1=0.1%, 2=0.1%, 4=0.1%, 8=0.1%, 16=0.1%, 32=0.1%, >=64=99.9%
     submit    : 0=0.0%, 4=100.0%, 8=0.0%, 16=0.0%, 32=0.0%, 64=0.0%, >=64=0.0%
     complete  : 0=0.0%, 4=100.0%, 8=0.0%, 16=0.0%, 32=0.0%, 64=0.1%, >=64=0.0%
     issued rwts: total=0,56770,0,0 short=0,0,0,0 dropped=0,0,0,0
     latency   : target=0, window=0, percentile=100.00%, depth=64

Run status group 0 (all jobs):
  WRITE: bw=1890MiB/s (1982MB/s), 1890MiB/s-1890MiB/s (1982MB/s-1982MB/s), io=111GiB (119GB), run=60077-60077msec

Disk stats (read/write):
    dm-0: ios=1/103282, merge=0/0, ticks=4/6786544, in_queue=6786548, util=98.98%, aggrios=1/178612, aggrmerge=0/11594, aggrticks=8/11652227, aggrin_queue=11730682, aggrutil=98.90%
  vda: ios=1/178612, merge=0/11594, ticks=8/11652227, in_queue=11730682, util=98.90%
Also Anbindung an Proxmox scheint ok zu sein, es muss also eine Einstellung im UCS liegen warum SMB keine Performance bringt. Getestet habe ich die Performance welche unter Windows Server 2022(in Domain), Windows 11 Enterprise (in Domain) und Windows 10 Enterprise (nicht in Domain integriert) alle identisch waren
Für eure Hilfe wäre ich euch dankbar. 