Problem:
Master is not shown on the dashboard anymore
Investigation:
- You need to check the time on your servers
- Does the master object still has the metrics-node service?
univention-ldapsearch -LLL cn=<master> univentionService
univentionService: metrics-node
univentionService: prometheus
univentionService: metrics-prometheus
univentionService: dashboard
- Do all servers occur in the targets.json?
cat /var/lib/univention-appcenter/apps/prometheus/conf/targets.json - You have two container running?
# docker ps
CONTAINER ID        IMAGE                                                  COMMAND                  CREATED             STATUS              PORTS                      NAMES
5a4e9d870531        docker.software-univention.de/grafana/grafana:6.1.6    "/run.sh"                About an hour ago   Up About an hour    0.0.0.0:3000->3000/tcp     tender_heisenberg
d99370e18ab4        docker.software-univention.de/prom/prometheus:v2.4.3   "/bin/prometheus -..."   About an hour ago   Up About an hour    127.0.0.1:9090->9090/tcp   blissful_bartik
- You can check if there are errors in the targets:
In the webinterface of the dashboard database you can login with admin credentials:
https://master.schein.ig/metrics-prometheus/targets
Solution:
If you use a wildcard certificate you may find this kind of error:
Error message in target:

Get https://master.schein.ig:443/metrics-node/metrics/: x509:
certificate signed by unknown authority
Or if you use a certificate that is not valid for the internal hostname:
Get https://srv-ucsm01.schule-example.de:443/metrics-node/metrics/:
x509: certificate is valid for portal.schule-example.de, not srv-ucsm01.schule-example.de
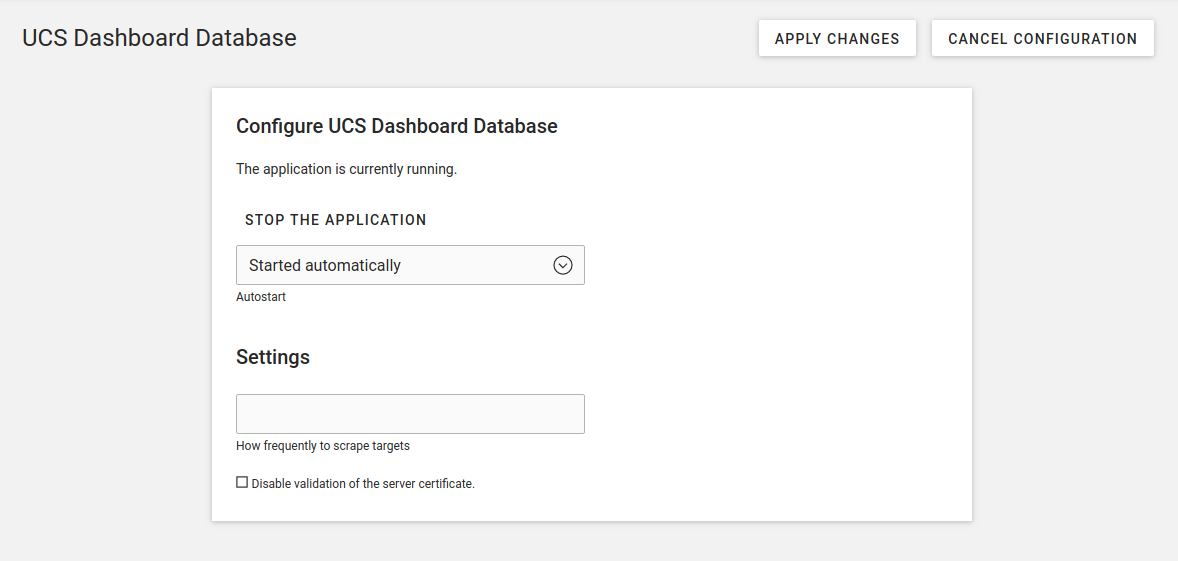
You can switch off the certificate validation: