How To: External Linux Server Metrics to Prometheus and Grafana on UCS
Summary
This article explains how to install and configure the Prometheus Node Exporter on a non-UCS system and integrate its metrics into Prometheus and Grafana running on Univention Corporate Server (UCS).
Prerequisites
- A running UCS system with Prometheus and Grafana installed via the Univention App Center.
- Access to the target Linux server where Node Exporter will be installed.
- Administrative permissions on both systems.
Step 1: Install Node Exporter
On the target Linux server, install the Prometheus Node Exporter:
sudo apt install prometheus-node-exporter
Alternatively, follow the official Node Exporter installation guide:
![]() Prometheus Node Exporter Documentation
Prometheus Node Exporter Documentation
Step 2: Verify Node Exporter
After installation, Node Exporter will run on port 9100. Verify the exporter with curl from the UCS Server by replacing the IP address with that of your server for the new metrics:
curl http://10.222.2.254:9100/metrics
root@ucs5backup:~/univention-support# curl http://10.222.2.254:9100/metrics | less
  % Total    % Received % Xferd  Average Speed   Time    Time     Time  Current
                                 Dload  Upload   Total   Spent    Left  Speed
  0     0    0     0    0     0      0      0 --:--:-- --:--:-- --:--:--     0# HELP apt_autoremove_pending Apt package pending autoremove.
# TYPE apt_autoremove_pending gauge
apt_autoremove_pending 0
# HELP apt_upgrades_pending Apt package pending updates by origin.
# TYPE apt_upgrades_pending gauge
apt_upgrades_pending{arch="all",origin="Ubuntu:22.04/jammy-security,Ubuntu:22.04/jammy-updates"} 5
apt_upgrades_pending{arch="amd64",origin=".xenial:xenial"} 1
apt_upgrades_pending{arch="amd64",origin="DockerCE:jammy"} 2
apt_upgrades_pending{arch="amd64",origin="Google:1.0/stable"} 1
apt_upgrades_pending{arch="amd64",origin="Ubuntu:22.04/jammy-security,Ubuntu:22.04/jammy-updates"} 7
apt_upgrades_pending{arch="amd64",origin="namespaces/moz-fx-productdelivery-pr-38b5/repositories/mozilla:mozilla"} 1
apt_upgrades_pending{arch="i386",origin="Ubuntu:22.04/jammy-security,Ubuntu:22.04/jammy-updates"} 1
# HELP go_gc_duration_seconds A summary of the pause duration of garbage collection cycles.
# TYPE go_gc_duration_seconds summary
go_gc_duration_seconds{quantile="0"} 1.4009e-05
go_gc_duration_seconds{quantile="0.25"} 2.9161e-05
go_gc_duration_seconds{quantile="0.5"} 5.922e-05
go_gc_duration_seconds{quantile="0.75"} 7.9345e-05
go_gc_duration_seconds{quantile="1"} 0.000815304
go_gc_duration_seconds_sum 0.046514702
go_gc_duration_seconds_count 666
# HELP go_goroutines Number of goroutines that currently exist.
# TYPE go_goroutines gauge
go_goroutines 9
<skip>
You should see a list of metrics exposed by Node Exporter.
Step 3: Configure Prometheus
Edit the Prometheus configuration file on your UCS system. The configuration is usually located at:
/var/lib/univention-appcenter/apps/prometheus/conf/prometheus.yml
Refer to the Prometheus documentation for details:
![]() Prometheus Node Exporter Scraping Guide
Prometheus Node Exporter Scraping Guide
Add or extend the following configuration:
scrape_configs:
  - job_name: 'univention'
    scrape_interval: 1m
<skip>
      username: prome-79812159$
      password: 05f442726e25a7a4f05f72cf02486dc1e272a9adfa9e19f07242223e58cf8e18

  # --- NEW JOB START ---
  - job_name: 'linux_servers_node_exporter'
    static_configs:
      - targets: ['10.222.2.254:9100']
        labels:
          instance: 'Norbo-Ubuntu-Client'
  # --- NEW JOB END ---
Step 4: Restart Prometheus and Admin Dashboard
Apply the new configuration by restarting the containers:
univention-app restart prometheusunivention-app restart admin-dashboard
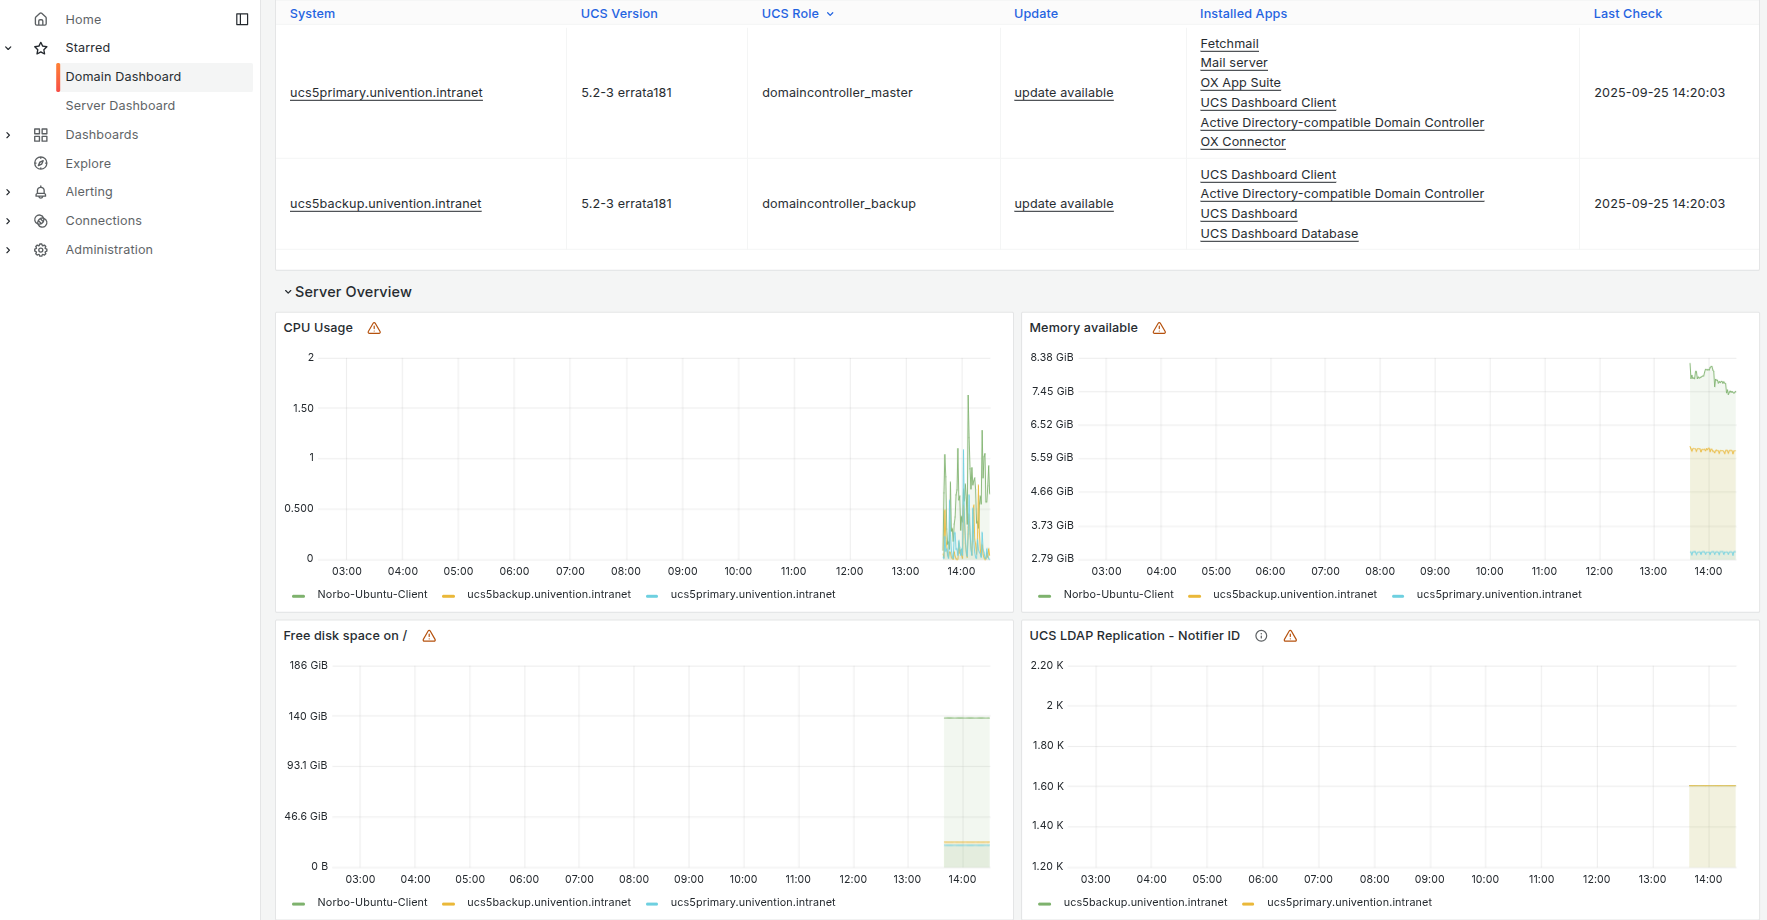
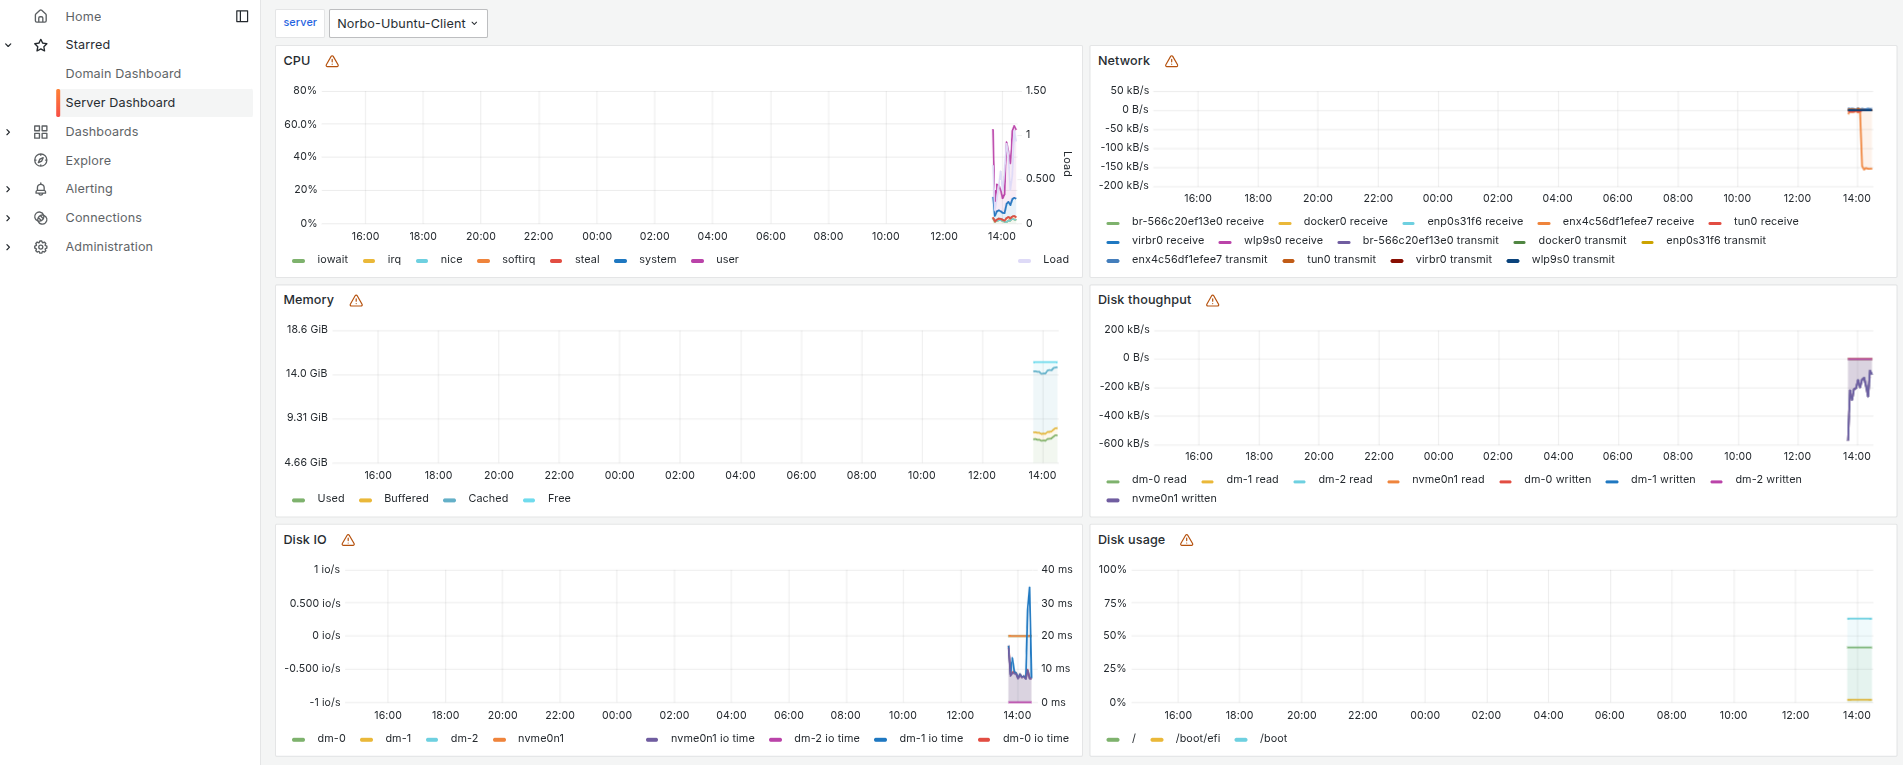
Step 5: Verify Metrics in Grafana
After the restart, the Node Exporter metrics should be visible in Grafana under:
- Domain Dashboard → Server Overview
- Server Dashboard
Step 6: Troubleshooting Duplicate or Corrupted Metrics
If metrics appear duplicated or incorrect, the Prometheus database may need to be reset.
Remove the data directory and restart Prometheus:
rm -r /var/lib/univention-appcenter/apps/prometheus/data/data/univention-app restart prometheus
Prometheus will regenerate the database, and metrics should then be displayed correctly in Grafana.
If issues occur, it is recommended to check the container logs directly by running:
univention-app logs prometheus
Hint:
One difference between installing Prometheus Node Exporter from the Debian or Ubuntu repositories and installing it from the Univention App Center is that metrics are pulled via different paths. It is important to note that on a UCS system, the command must end with a / so that the request also outputs the requested metrics.
On my Ubuntu, the following would be correct:
curl -v http://localhost:9100/metricsOn a UCS system, it would be as follows:
curl -v http://localhost:9100/metrics-node/metrics/
![]() With this setup, Node Exporter metrics from non-UCS Linux servers can be successfully integrated into the Univention Prometheus and Grafana monitoring stack.
With this setup, Node Exporter metrics from non-UCS Linux servers can be successfully integrated into the Univention Prometheus and Grafana monitoring stack.
See also: