Table of contents
- Introduction
- What is Kubernetes?
- What are containers?
- What are pods?
- Matryoshka
- Explore Kind cluster
- Retrieve information
- Read logs
- Namespaces
- Accessing the cluster network — the Ingress controller
- Install WordPress
- Scaling
- Cleanup
Introduction
This is an accompanying article for Install Nubus for Kubernetes on your notebook in 20 minutes.
It explains and explores a few details of Kubernetes.
It assumes that the reader has installed all tools from section Install tools in the host of the mentioned article.
The official Kubernetes documentation is excellent. You can find it at: Kubernetes Documentation | Kubernetes
If you’re looking for a specific topic or a YAML template for a Kubernetes object, just use your favorite search engine, and the top results will always link to it (e.g., search for “kubernetes ingress”).
What is Kubernetes?
Kubernetes (K8s) is a container orchestration tool.
It allows to largely automate the operations required for container lifecycle management (provisioning, deployment, scaling, networking, load balancing, …).
Of course, containers can be managed without Kubernetes. It is common to start, stop and update one or a few containers using Docker or Docker-Compose.
That is not much work on the command line or using a graphical tool. But what if you want to manage 50 containers, or 5000? This is where “container orchestration” comes into play.
An important concept to understand is that a Kubernetes system is not managed through commands, but through configuration and rules!
You configure the desired target state through an API, and the Kubernetes services reconfigure the cluster so the current state is transformed to the target state.
Kubernetes services live in the control plane which is strictly separated from the workload (the user’s applications).
Thus, a separation between technical administrator (operator) and system administrator is an inherent part of Kubernetes deployments.
The technical operator accesses the control plane to deploy applications, and the system administrator works with the application.
There is a third administration level: That of the “Kubernetes administrator.” That role is responsible for managing the cluster and its resources (hardware, network, load balancers, …).
In short:
- Kubernetes administrators create the cluster, manage its resources, and give technical operators (limited) access to them.
- Technical operators use the available cluster resources to deploy and manage (configure, scale, observe, …) applications. They create (initial) system administrator accounts.
- System administrators use the installed applications and manage end-users. Application configuration and user management can only be done using the application’s interface (usually HTTP).
What are containers?
Containers are a virtualization technology similar to virtual machines (VMs) that isolate a process (and its children) from the real machine or system by intercepting and redirecting access to its resources. Containers differ from VMs in that the host kernel manages all processes and the environments in which they are executed (filesystem, memory, network, etc.).
The operating system kernel assigns each process to a namespace, including the processes started in the host.
When a process wants to access a resource, e.g., asks to read the directory /etc, the kernel looks into a table, using the ID of the process‘ namespace, finds the root filesystem for that namespace, and returns the path etc relative to that.
When a process in the host asks that question, it gets back /etc.
When a process in a container asks the same question, it gets back something like /var/docker/<namespace>/etc (from the host’s perspective, the process in the container thinks it is /etc).
This mechanic requires far fewer resources than running virtual machines, where a separate kernel runs in each “namespace” (virtual machine), and software (the “hypervisor”) simulates a dedicated host with virtual hardware for each kernel.
The overhead of containers is so low that it is completely OK to split a single service into multiple processes and start a separate container for each process.
This separation allows for distributed development, fine-grained security policies, and scaling automation.
But producing many containers means managing many containers — hence the fondness of microservice operators for Kubernetes.
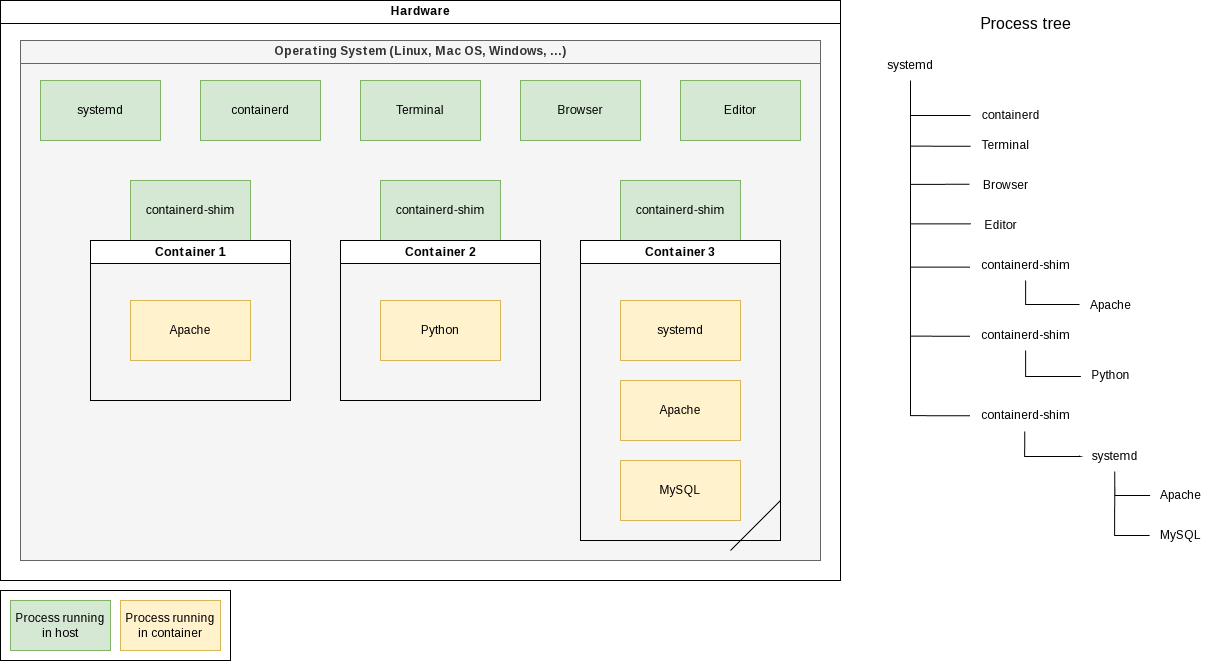
In the above diagram (to see original size: right-click → open in new tab) is a physical machine running an operating system (OS).
The OS has started multiple processes: systemd, containerd, Terminal, Browser, Editor, and twice containerd-shim.
containerd manages containers, and containerd-shim is a helper process for communicating with the low-level hidden container runtime (runc).
Three containers are running.
Two with precisely one process — Docker best practice — and one with an init system (systemd) and multiple processes — “VM style.”
In a Linux system, all processes form a dependency tree, with process number 1 at the root.
A “parent process” can control certain aspects of its “child processes.”
When a parent dies, so do all its children.
I mentioned before that processes in containers use the host’s kernel.
Thus, they all live in the same process tree. That means they are all visible from the host!
Do the following to see it: Start a small Docker container in the background and search in your host’s process list for the started process.
You’ll find the sleep process as a child process of a containerd-shim process:
$ docker run -d busybox sleep 60
7f480fbdf81609998008c978cd7083a951fab52022d544bf7144e2af3b7a5c49

$ pstree -TU

systemd─┬─ModemManager
        ├─NetworkManager
        ├─accounts-daemon
# [..]
        ├─containerd-shim───sleep
# [..]                      ^^^^^
What are pods?
Pods are the smallest deployable units of computing that you can create and manage in Kubernetes.
A pod is a group of one or more containers, with shared storage and network resources (kubernetes.io docs).
Usually a pod contains a single container for a service. Additional containers may be so-called “side-car containers,” e.g., used to collect logs, or init-containers, used for initialization.
Matryoshka
On a production Kubernetes node, multiple services would be running in the host, many storage devices would show up, and the network would have unique settings. That’s not something we want on our desktop machine. We want to test Kubernetes and Nubus, throw them away, and have a clean system afterward.
With that scenario (mostly for developers) in mind, a Kubernetes distribution found an elegant solution: Kind is a Kubernetes distribution that is very nice to use on notebooks because it does not add any service to your system.
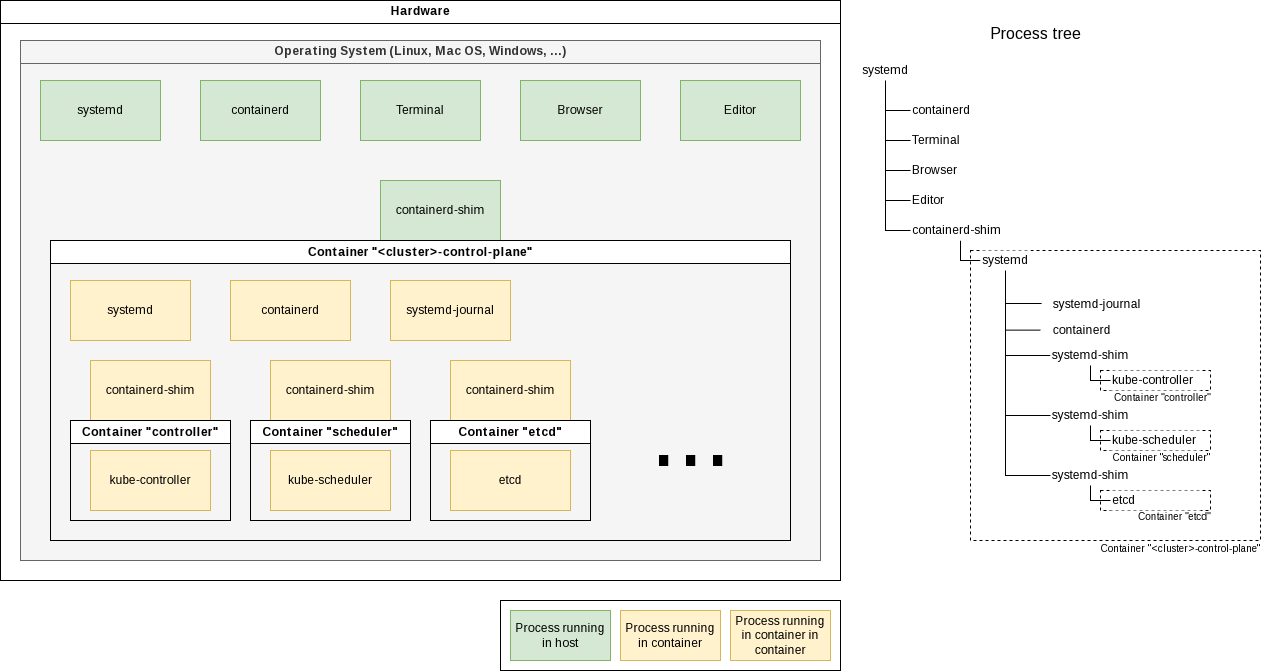
“Kind” is an abbreviation for “Kubernetes in Docker.” That describes exactly what it does: It uses “Docker in Docker” (DinD) to run a complete Kubernetes environment in a single Docker container.

In the below diagram (to see original size: right-click → open in new tab), a container <cluster>-control-plane is started in the host.
Inside that container, an init system (systemd), a logging server (journald), container management (containerd), and multiple container-shim processes are started:
You can see that on the command line:
$ pstree -TU

systemd─┬─ModemManager
        ├─NetworkManager
        ├─accounts-daemon
        ├─acpid
        ├─agetty
# [..]
        ├─containerd
        ├─containerd-shim───systemd─┬─containerd
        │                           ├─containerd-shim─┬─kube-controller
        │                           │                 └─pause
        │                           ├─containerd-shim─┬─kube-scheduler
        │                           │                 └─pause
        │                           ├─containerd-shim─┬─etcd
        │                           │                 └─pause
        │                           ├─containerd-shim─┬─kube-apiserver
        │                           │                 └─pause
        │                           ├─containerd-shim─┬─kube-proxy
        │                           │                 └─pause
        │                           ├─containerd-shim─┬─kindnetd
        │                           │                 └─pause
        │                           ├─2*[containerd-shim─┬─coredns]
        │                           │                    └─pause]
        │                           ├─containerd-shim─┬─local-path-prov
        │                           │                 └─pause
        │                           ├─containerd-shim─┬─dumb-init───nginx-ingress-c───nginx───17*[nginx]
        │                           │                 └─pause
        │                           ├─kubelet
        │                           └─systemd-journal
# [..]
You can dive one layer deeper (by executing ps inside the container):
$ docker exec -it <cluster>-control-plane ps axf

    PID TTY      STAT   TIME COMMAND
  69481 pts/1    Rs+    0:00 ps axf
      1 ?        Ss     0:11 /sbin/init
     96 ?        Ss     0:00 /lib/systemd/systemd-journald
    111 ?        Ssl   97:09 /usr/local/bin/containerd
    314 ?        Sl     1:14 /usr/local/bin/containerd-shim-runc-v2 ...
    404 ?        Ss     0:00  \_ /pause
    577 ?        Ssl   82:32  \_ kube-controller-manager ...
    315 ?        Sl     1:14 /usr/local/bin/containerd-shim-runc-v2 ...
    411 ?        Ss     0:00  \_ /pause
    531 ?        Ssl   21:05  \_ kube-scheduler ...
# ..
   2516 ?        Ss     0:00  \_ /usr/bin/dumb-init -- /nginx-ingress-controller ...
   2534 ?        Ssl    4:54      \_ /nginx-ingress-controller ...
   2566 ?        S      0:00          \_ nginx: master process ...
   2570 ?        Sl     0:57              \_ nginx: worker process
   2571 ?        Sl     0:38              \_ nginx: worker process
#..
Explore Kind cluster
After creating a cluster with kind create cluster --name=test1, you have a single running Docker container:
docker ps
CONTAINER ID   IMAGE                  COMMAND                  CREATED          STATUS          PORTS                       NAMES
b79d7759f516   kindest/node:v1.32.0   "/usr/local/bin/entr…"   38 seconds ago   Up 33 seconds   127.0.0.1:33155->6443/tcp   test1-control-plane
There’s a whole world inside that container. Explore it:
Retrieve information
Inside the Docker container, more containers are started. But those containers are not controlled using Docker, but crictl. It is very similar to use:
docker exec -it test1-control-plane crictl --help
It has the same commands as the docker CLI:
docker exec -it test1-control-plane crictl images
docker exec -it test1-control-plane crictl ps
docker exec -it test1-control-plane crictl stats
And additional ones for handling pods:
docker exec -it test1-control-plane crictl pods
docker exec -it test1-control-plane crictl statsp
Read logs
You can read the logs of a container.
Let’s look at the logs of the Kubernetes configuration database “etcd.”
You’ll find its container using crictl ps | grep etcd ´(inside the Kind Docker container).
Then you can use crictl logs $CONTAINER_ID ´(inside the Kind Docker container) to retrieve the logs.
CONTAINER_ID="$(docker exec -it test1-control-plane crictl ps | grep etcd | cut -f 1 -d ' ')"
docker exec -it test1-control-plane crictl logs "$CONTAINER_ID"
The logs are in JSON format. That’s common for Kubernetes services. It facilitates the automatic ingestion of them by log aggregators.
For easier reading, you can pipe the output through jq:
CONTAINER_ID="$(docker exec -it test1-control-plane crictl ps | grep etcd | cut -f 1 -d ' ')"
docker exec -it test1-control-plane crictl logs "$CONTAINER_ID" | jq
This kind of access is not portable — it’s a little bit “to low-level,” because it accesses the container directly. But in Kubernetes the smallest unit is a pod. So instead, we should be doing the following:
Find out the name of the pod:
kubectl get pods -A
NAMESPACE            NAME                                          READY   STATUS    RESTARTS   AGE
# ...
kube-system          etcd-test1-control-plane                      1/1     Running   0          36m
# ...
Now we can read its logs using kubectl logs -n <namespace> <pod id>. This command works with all Kubernetes clusters, being it you own cluster or one at AWS, Google or Ionos.
kubectl logs -n kube-system etcd-test1-control-plane
Namespaces
The -n / --namespace switch defines the namespace into which we are looking.
Namespaces are way to group and scope Kubernetes objects.
When -n is omitted, the namespace default is automatically chosen.
With some kubectl commands we can use the -A flag to select all namespaces.
Accessing the cluster network — the Ingress controller
By default, Kubernetes limits network connections to containers to other containers inside the cluster.
Thus, the new cluster doesn’t have any ports open to the outside world.
(From the cluster’s point of view, the notebook is the “outside world.”)
Ingress manages external access to the services in a cluster, typically HTTP.
Ingress may provide load balancing, SSL termination, and name-based virtual hosting
(official documentation).
“Ingress controllers” are typically reverse proxies like Nginx.
So, we need an Ingress controller to forward connections from outside the cluster to a service on the inside.
But in our case, we need one more thing:
Our cluster runs inside a Docker container, and Docker does not support adding port-mappings at runtime.
So, we have to configure the ports that the Ingress controller should offer at Docker container creation time,
and thus at cluster creation time.
If you installed the cluster using kind create cluster --name=test1, then delete the cluster and this time create it with the configuration from the other article (Create a cluster):
kind delete clusters test1
Store the following cluster configuration in a file called kind-cluster-config.yaml. Take care to keep the indentation because the YAML format is strict about that.
kind: Cluster
apiVersion: kind.x-k8s.io/v1alpha4
nodes:
- role: control-plane
  kubeadmConfigPatches:
  - |
    kind: InitConfiguration
    nodeRegistration:
      kubeletExtraArgs:
        node-labels: "ingress-ready=true"
  extraPortMappings:
  - containerPort: 80
    hostPort: 80
    protocol: TCP
  - containerPort: 443
    hostPort: 443
    protocol: TCP
Now, create the cluster. Let’s call it wordpress:
kind create cluster --name=wordpress --config=kind-cluster-config.yaml
Creating cluster "wordpress" ...
 ✓ Ensuring node image (kindest/node:v1.32.0) 🖼
 ✓ Preparing nodes 📦
 ✓ Writing configuration 📜
 ✓ Starting control-plane 🕹️
 ✓ Installing CNI 🔌
 ✓ Installing StorageClass 💾
Set kubectl context to "kind-wordpress"
You can now use your cluster with:

kubectl cluster-info --context kind-wordpress

Thanks for using kind! 😊
This time the Docker container will have port-forwardings (see column PORTS) that will connect to the Ingress controller:
docker ps
CONTAINER ID   IMAGE                  COMMAND                  CREATED          STATUS          PORTS                                                                 NAMES
5c164e708631   kindest/node:v1.32.0   "/usr/local/bin/entr…"   53 seconds ago   Up 51 seconds   0.0.0.0:80->80/tcp, 0.0.0.0:443->443/tcp, 127.0.0.1:37203->6443/tcp   wordpress-control-plane
Install the Ingress controller as written in section Install the Ingress controller:
helm upgrade --install ingress-nginx ingress-nginx \
     --repo https://kubernetes.github.io/ingress-nginx \
     --namespace ingress-nginx \
     --create-namespace \
     --version "4.8.0" \
     --set controller.allowSnippetAnnotations=true \
     --set controller.config.hsts=false \
     --set controller.service.enableHttps=false \
     --set controller.hostPort.enabled=true \
     --set controller.service.ports.http=80
Install WordPress
To further explore Kubernetes, we’ll install the blogging software WordPress.
We’ll use the Helm chart of the Bitnami package for WordPress.
The helm install command accepts settings with the --set option, e.g.: --set ingress.enabled=true.
But best practice is to store your settings in a YAML file, typically called values.yaml.
The ArtifactHub page for the Helm chart lists all available settings and offers to download a YAML file with all defaults.
We’ll do that and change one setting:
wget https://raw.githubusercontent.com/bitnami/charts/main/bitnami/wordpress/values.yaml
Edit values.yaml and set ingress.enabled (line 619) to true, ingressClassName (line 630) to "nginx", and ingress.hostname (line 633) to "wordpress.test":
ingress:
  ## @param ingress.enabled Enable ingress record generation for WordPress
  ##
  enabled: true

  ## @param ingress.ingressClassName IngressClass that will be be used to implement the Ingress (Kubernetes 1.18+)
  ## This is supported in Kubernetes 1.18+ and required if you have more than one IngressClass marked as the default for your cluster .
  ## ref: https://kubernetes.io/blog/2020/04/02/improvements-to-the-ingress-api-in-kubernetes-1.18/
  ##
  ingressClassName: "nginx"

  ## @param ingress.hostname Default host for the ingress record. The hostname is templated and thus can contain other variable references.
  ##
  hostname: wordpress.test
Then install WordPress:
helm install my-wordpress oci://registry-1.docker.io/bitnamicharts/wordpress -f values.yaml
We didn’t supply a namespace using -n <namespace>, so it will be installed into the namespace default.
Because the installation runs in the background, this output is shown immediately:
Pulled: registry-1.docker.io/bitnamicharts/wordpress:24.1.5
Digest: sha256:a295daca185bee8cc8f76f91eac6a6b258b61951bb413a234f0b2a539b04a668
NAME: my-wordpress
LAST DEPLOYED: Wed Dec 18 12:34:58 2024
NAMESPACE: default
STATUS: deployed
REVISION: 1
TEST SUITE: None
NOTES:
CHART NAME: wordpress
CHART VERSION: 24.1.5
APP VERSION: 6.7.1

Did you know there are enterprise versions of the Bitnami catalog? For enhanced secure software supply chain features, unlimited pulls from Docker, LTS support, or application customization, see Bitnami Premium or Tanzu Application Catalog. See https://www.arrow.com/globalecs/na/vendors/bitnami for more information.

** Please be patient while the chart is being deployed **

Your WordPress site can be accessed through the following DNS name from within your cluster:

    my-wordpress.default.svc.cluster.local (port 80)

To access your WordPress site from outside the cluster follow the steps below:

1. Get the WordPress URL and associate WordPress hostname to your cluster external IP:

   export CLUSTER_IP=$(minikube ip) # On Minikube. Use: `kubectl cluster-info` on others K8s clusters
   echo "WordPress URL: http://wordpress.test/"
   echo "$CLUSTER_IP  wordpress.test" | sudo tee -a /etc/hosts

2. Open a browser and access WordPress using the obtained URL.

3. Login with the following credentials below to see your blog:

  echo Username: user
  echo Password: $(kubectl get secret --namespace default my-wordpress -o jsonpath="{.data.wordpress-password}" | base64 -d)

WARNING: There are "resources" sections in the chart not set. Using "resourcesPreset" is not recommended for production. For production installations, please set the following values according to your workload needs:
  - resources
+info https://kubernetes.io/docs/concepts/configuration/manage-resources-containers/
You have two new pods in the default namespace:
kubectl get pods
NAME                            READY   STATUS            RESTARTS   AGE
my-wordpress-557cbb9647-dntzr   0/1     Running           0          42s
my-wordpress-mariadb-0          0/1     PodInitializing   0          42s
And two new images:
docker exec -it wordpress-control-plane crictl images
IMAGE                                                TAG                   IMAGE ID            SIZE
docker.io/bitnami/mariadb                            11.4.4-debian-12-r2   bcee6a4727d5c       132MB
docker.io/bitnami/wordpress                          6.7.1-debian-12-r9    0def4d72db71e       215MB
# ..
The Ingress controller got instructions to change its configuration.
You can read its logs:
$ kubectl --namespace ingress-nginx get pods
NAME                                        READY   STATUS    RESTARTS   AGE
ingress-nginx-controller-6787bf559d-sfxks   1/1     Running   0          6m29s
kubectl logs --namespace ingress-nginx ingress-nginx-controller-6787bf559d-sfxks
-------------------------------------------------------------------------------
NGINX Ingress controller
  Release:       v1.9.0
  Build:         4bd3d6b8a00b01b009f225a5593ce502cce5c26b
  Repository:    https://github.com/kubernetes/ingress-nginx
  nginx version: nginx/1.21.6

-------------------------------------------------------------------------------

W1218 11:30:34.364834      14 client_config.go:618] Neither --kubeconfig nor --master was specified.  Using the inClusterConfig.  This might not work.
I1218 11:30:34.365146      14 main.go:205] "Creating API client" host="https://10.96.0.1:443"
I1218 11:30:34.376410      14 main.go:249] "Running in Kubernetes cluster" major="1" minor="32" git="v1.32.0" state="clean" commit="70d3cc986aa8221cd1dfb1121852688902d3bf53" platform="linux/amd64"
# ...
I1218 11:51:05.304124      14 event.go:298] Event(v1.ObjectReference{Kind:"Ingress", Namespace:"default", Name:"my-wordpress", UID:"3d5bf044-eaa7-4ae6-b7ab-75ebe3841281", APIVersion:"networking.k8s.io/v1", ResourceVersion:"2579", FieldPath:""}): type: 'Normal' reason: 'Sync' Scheduled for sync
I1218 11:51:05.304866      14 controller.go:190] "Configuration changes detected, backend reload required"
I1218 11:51:05.425207      14 controller.go:210] "Backend successfully reloaded"
I1218 11:51:05.425652      14 event.go:298] Event(v1.ObjectReference{Kind:"Pod", Namespace:"ingress-nginx", Name:"ingress-nginx-controller-6787bf559d-sfxks", UID:"738aba22-8ef8-4ad5-a1eb-c99ee801f4e6", APIVersion:"v1", ResourceVersion:"610", FieldPath:""}): type: 'Normal' reason: 'RELOAD' NGINX reload triggered due to a change in configuration
Hint: If you installed the shell completions, you don’t need to look up the pod name. You can just double-tab after kubectl logs --namespace to get the available namespaces and after selecting one, double-tab to get the available pods in that namespace.
To access the WordPress site, you need a working DNS configuration.
You can simulate that by appending this to the /etc/hosts file of your system (the one running the web browser):
127.0.0.3 wordpress.test
echo "127.0.0.3 wordpress.test" | sudo tee -a /etc/hosts >/dev/null
If you have not installed the Kind cluster on your desktop machine, then you must use the IP address of the machine with the Kind cluster. If that is 192.168.0.34, then the line in /etc/hosts would be: 192.168.0.34 wordpress.test
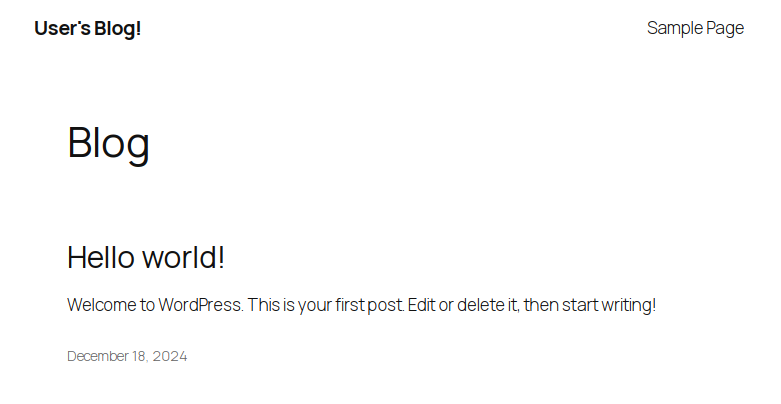
If you now open http://wordpress.test/ in your browser, you’ll be greeted with a blog page.
… or an HTTP 5xx error, if there was a problem. In that case, read the logs of the two pods:
kubectl get pods # omitting the namespace is the same as using "--namespace default"
NAME                            READY   STATUS    RESTARTS   AGE
my-wordpress-557cbb9647-dntzr   1/1     Running   0          9m6s
my-wordpress-mariadb-0          1/1     Running   0          9m6s
kubectl logs my-wordpress-557cbb9647-dntzr
# ...
kubectl logs my-wordpress-mariadb-0
If everything worked out, and you get a blog page, your access will be logged by WordPress and Ingress:
kubectl logs --namespace ingress-nginx -f ingress-nginx-controller-55bbd74b5f-2nzsc
10.205.2.122 - - [18/Dec/2024:11:57:56 +0000] "GET /favicon.ico HTTP/1.1" 302 0 "http://wordpress.test/" "Mozilla/5.0 (X11; Linux x86_64) AppleWebKit/537.36 (KHTML, like Gecko) Chrome/131.0.0.0 Safari/537.36" 429 0.032 [default-my-wordpress-http] [] 10.244.0.10:8080 0 0.032 302 b28cba4f431e44a7ac65e6bc30d141c6
# ...
And also in the logs of the WordPress pod:
kubectl logs -f my-wordpress-557cbb9647-dntzr
10.244.0.6 - - [18/Dec/2024:11:57:56 +0000] "GET /favicon.ico HTTP/1.1" 302 -
# ...
The forum software limits the maximum length of an article. So this one continues in the following comment…