Cpu usage buggy

Hello i have the following problem

With top:
image

But in univention Statistics
image

This is a server that isn’t in full prodution… is a virtual machine, but i have other virtual machne and none o them have this issues, VM with same settings and same univention version

Hi,

what is your issue exactly?

There are samba-processes running. Do mean no one is using this computer? And Samba load is high anyways?

If this is the case, have you checked this article?

/CV

Hello, the problem are …

  • nobody is using the server.
  • the sum off the top is very different from the univention web page… where it overpass the 100%

I do not really see a mismatch in the numbers here. How many CPUs does your virtual server have?

The “load” seen here -even if shown as percentage (%)- counts usually per CPU. So if you have 8 CPUs the maximum value would be here 800% of usage. This is typical Linux-behaviour.

Second, top shows both types of values. In the head the %Cpu(s) is calculated among all available CPUs while the %CPU in the table usually is calculated per single CPU (I am not perfectly sure about this, though).

Third, CPU usage calculations within virtual machines are very likely to be miscalculated as they set the usage in relation to the time passed. But when the hypervisor does not schedule a CPU slot for the vm because of low useage, the vm itself sees more usage than happens really.

So the interesting thing is the statistic of your hypervisor telling about the CPU usage of the vm.

/CV

There is at least one bugreport for univention-system-stats (https://forge.univention.org/bugzilla/show_bug.cgi?id=42292) which mentions that at the time where the stats are collected other system processes may run and affect the results.

Like i said i have more vms in the same (configuration) but none of them have this behaviour…

Some pics with it apper be ok with xcp-ng and ucs server
image
image
image
(my point… eveything appear to be consistent…)

Now the server with problems…
image
image
image

This last image overpass the 100% and that should be normal… in my opinion… even that rule you refer … this vm have only two cores… so i guess shouldn’t pass 200% ?

Ok, this looks at least a little bit weird. But before trying to fix a possible CPU usage display error I would suggest to first try to fix the samba process going bananas.

See if you see something strange at samba logs, try to restart (use /etc/init.d/samba restart) samba or use strace as mentioned in my previous post to see what samba is doing all the time.

Once samba is running fine and top itself shows usual behaviour we can try to cover the display issues.

/CV

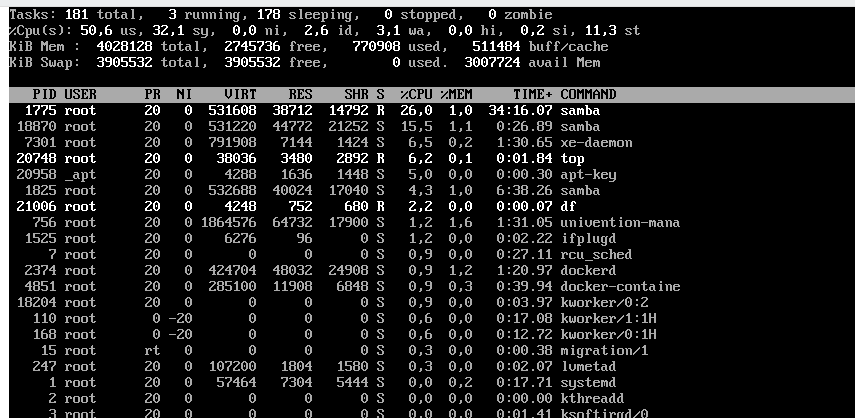
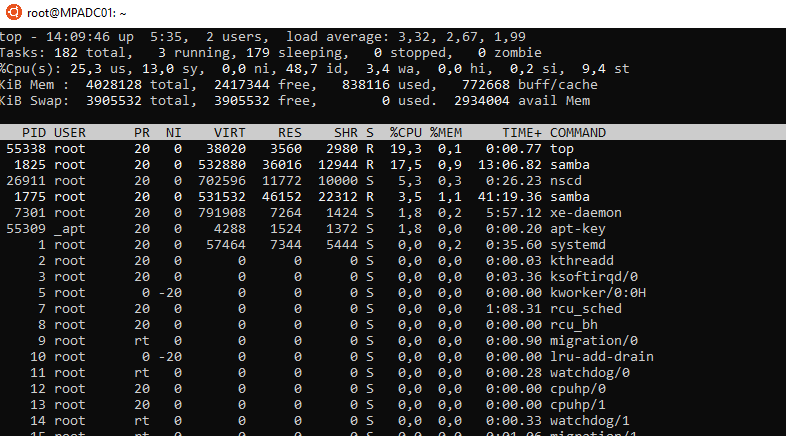
@Christian_Voelker i don’t see nothing relevant in samba logs…
About the strace i get this

fcntl(38, F_SETFD, FD_CLOEXEC)          = 0
getpid()                                = 1825
fcntl(10, F_SETLK, {l_type=F_RDLCK, l_whence=SEEK_SET, l_start=168, l_len=40000}) = 0
fcntl(10, F_SETLKW, {l_type=F_RDLCK, l_whence=SEEK_SET, l_start=40168, l_len=0}) = 0
fcntl(10, F_SETLKW, {l_type=F_UNLCK, l_whence=SEEK_SET, l_start=168, l_len=0}) = 0
close(38)                               = 0
fcntl(10, F_SETLK, {l_type=F_RDLCK, l_whence=SEEK_SET, l_start=168, l_len=40000}) = 0
fcntl(10, F_SETLKW, {l_type=F_RDLCK, l_whence=SEEK_SET, l_start=40168, l_len=0}) = 0
fcntl(11, F_SETLK, {l_type=F_RDLCK, l_whence=SEEK_SET, l_start=168, l_len=40000}) = 0
fcntl(11, F_SETLKW, {l_type=F_RDLCK, l_whence=SEEK_SET, l_start=40168, l_len=0}) = 0
fcntl(12, F_SETLK, {l_type=F_RDLCK, l_whence=SEEK_SET, l_start=168, l_len=40000}) = 0
fcntl(12, F_SETLKW, {l_type=F_RDLCK, l_whence=SEEK_SET, l_start=40168, l_len=0}) = 0
fcntl(14, F_SETLK, {l_type=F_RDLCK, l_whence=SEEK_SET, l_start=168, l_len=40000}) = 0
fcntl(14, F_SETLKW, {l_type=F_RDLCK, l_whence=SEEK_SET, l_start=40168, l_len=0}) = 0
fcntl(15, F_SETLK, {l_type=F_RDLCK, l_whence=SEEK_SET, l_start=168, l_len=40000}) = 0
fcntl(15, F_SETLKW, {l_type=F_RDLCK, l_whence=SEEK_SET, l_start=40168, l_len=0}) = 0
fcntl(13, F_SETLK, {l_type=F_RDLCK, l_whence=SEEK_SET, l_start=168, l_len=40000}) = 0
fcntl(13, F_SETLKW, {l_type=F_RDLCK, l_whence=SEEK_SET, l_start=40168, l_len=0}) = 0
fcntl(11, F_SETLKW, {l_type=F_UNLCK, l_whence=SEEK_SET, l_start=168, l_len=0}) = 0
fcntl(12, F_SETLKW, {l_type=F_UNLCK, l_whence=SEEK_SET, l_start=168, l_len=0}) = 0
fcntl(14, F_SETLKW, {l_type=F_UNLCK, l_whence=SEEK_SET, l_start=168, l_len=0}) = 0
fcntl(15, F_SETLKW, {l_type=F_UNLCK, l_whence=SEEK_SET, l_start=168, l_len=0}) = 0
fcntl(13, F_SETLKW, {l_type=F_UNLCK, l_whence=SEEK_SET, l_start=168, l_len=0}) = 0
fcntl(10, F_SETLKW, {l_type=F_UNLCK, l_whence=SEEK_SET, l_start=168, l_len=0}) = 0
close(37)                               = 0
epoll_create(64)                        = 37
fcntl(37, F_GETFD)                      = 0
fcntl(37, F_SETFD, FD_CLOEXEC)          = 0
getpid()                                = 1825
epoll_create(64)                        = 38
fcntl(38, F_GETFD)                      = 0
fcntl(38, F_SETFD, FD_CLOEXEC)          = 0
getpid()                                = 1825
fcntl(10, F_SETLK, {l_type=F_RDLCK, l_whence=SEEK_SET, l_start=168, l_len=40000}) = 0
fcntl(10, F_SETLKW, {l_type=F_RDLCK, l_whence=SEEK_SET, l_start=40168, l_len=0}) = 0
fcntl(10, F_SETLKW, {l_type=F_UNLCK, l_whence=SEEK_SET, l_start=168, l_len=0}) = 0
close(38)                               = 0
fcntl(10, F_SETLK, {l_type=F_RDLCK, l_whence=SEEK_SET, l_start=168, l_len=40000}) = 0
fcntl(10, F_SETLKW, {l_type=F_RDLCK, l_whence=SEEK_SET, l_start=40168, l_len=0}) = 0
fcntl(11, F_SETLK, {l_type=F_RDLCK, l_whence=SEEK_SET, l_start=168, l_len=40000}) = 0
fcntl(11, F_SETLKW, {l_type=F_RDLCK, l_whence=SEEK_SET, l_start=40168, l_len=0}) = 0
fcntl(12, F_SETLK, {l_type=F_RDLCK, l_whence=SEEK_SET, l_start=168, l_len=40000}) = 0
fcntl(12, F_SETLKW, {l_type=F_RDLCK, l_whence=SEEK_SET, l_start=40168, l_len=0}) = 0
fcntl(14, F_SETLK, {l_type=F_RDLCK, l_whence=SEEK_SET, l_start=168, l_len=40000}) = 0
fcntl(14, F_SETLKW, {l_type=F_RDLCK, l_whence=SEEK_SET, l_start=40168, l_len=0}) = 0
fcntl(15, F_SETLK, {l_type=F_RDLCK, l_whence=SEEK_SET, l_start=168, l_len=40000}) = 0
fcntl(15, F_SETLKW, {l_type=F_RDLCK, l_whence=SEEK_SET, l_start=40168, l_len=0}) = 0
fcntl(13, F_SETLK, {l_type=F_RDLCK, l_whence=SEEK_SET, l_start=168, l_len=40000}) = 0
fcntl(13, F_SETLKW, {l_type=F_RDLCK, l_whence=SEEK_SET, l_start=40168, l_len=0}) = 0
fcntl(11, F_SETLKW, {l_type=F_UNLCK, l_whence=SEEK_SET, l_start=168, l_len=0}) = 0
fcntl(12, F_SETLKW, {l_type=F_UNLCK, l_whence=SEEK_SET, l_start=168, l_len=0}) = 0
fcntl(14, F_SETLKW, {l_type=F_UNLCK, l_whence=SEEK_SET, l_start=168, l_len=0}) = 0
fcntl(15, F_SETLKW, {l_type=F_UNLCK, l_whence=SEEK_SET, l_start=168, l_len=0}) = 0
fcntl(13, F_SETLKW, {l_type=F_UNLCK, l_whence=SEEK_SET, l_start=168, l_len=0}) = 0
fcntl(10, F_SETLKW, {l_type=F_UNLCK, l_whence=SEEK_SET, l_start=168, l_len=0}) = 0
close(37)                               = 0

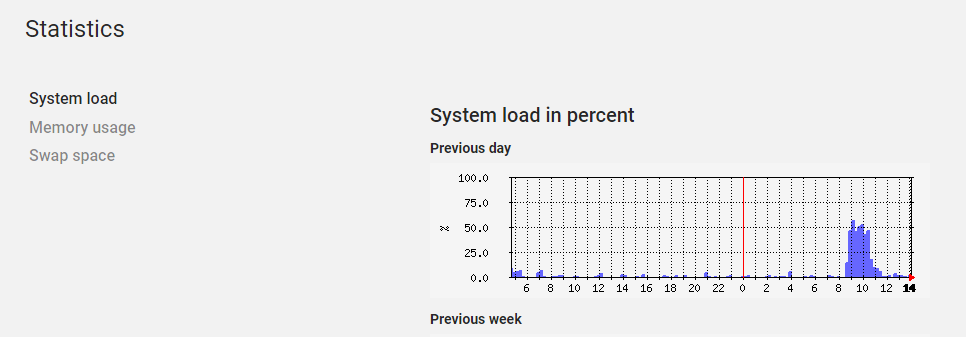
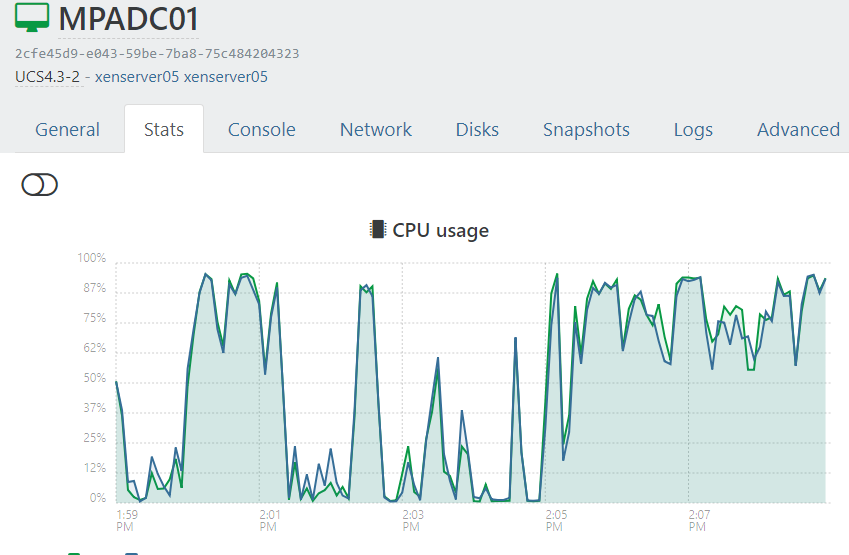
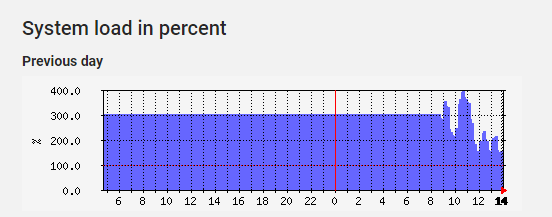
The last days i keep an eye before post… and restart the samba sometimes… but never have better results

This server have the latest errata…

Hi,

Well, the Samba process (is it the one in question hogging CPU ressources?) opens files with file descriptor 10, 11, 12, 13, 14 and 15.
Again, check the mentioned article (ls /proc…)- you will need to check which files these file descriptors represent.
/CV

@Christian_Voelker, i can’t afirm that… is one of the process for sure… but from top command isn’t always the higher cpu usage process.

That said… i already check that article… but i already have the latest samba, the ucs have the latest errata patch 4.3-2 so i don’t understand what you refer to that article… because the resolution of that is upgrade the samba right?

right now i will kill the samba and wait 1hour to see how the cpu usage goes

I am not referring to upgrade.
I am asking to troubleshoot. If you do it you will see which files samba is going to open and close permanently. Which could to be the reason for high CPU load.

I did not get it here from your statement- is this continuously the same samba process? Or do the process IDs change?
Another reason might be the limit of open files reached but currently it does not look like this.

/CV

@Christian_Voelker, what i mean is that the solution in that article is:

Solution

Upgrade to UCS 4.3 which ships updated Samba 4.7 by default

And i’m already in that version… so i don’t know that…

About the troubleshoot, i’m doing it… and i’m thank you for your help :wink:

Like i said before all the samba services are stoped right now, but the cpu usage is still high
image
image

Ok, I got it now. Well, then your issue is indeed not related to samba.

But looking at your screenshots I still do not see any real issues. Yes, CPU load appears to be high with 32.9% and 25.4% but it looks like there are some tasks running at the moment. In the above it is top using 10% which can happen as top is running. 12 seconds later there is “tr” and “apt-key” running which indicates some script being executed as well as the sysvol-sync.sh.

My point here is the “load average” in the first line: For one minute it is 2.10, for 5 minutes it is 1.20 and for the last 15 minutes it is 0.84.
This indicates there has been some load on the system for the last couple of minutes, but not before.

I do not doubt your notice of high CPU load somehow, but I do not see it here.

BTW: The load value sometimes is a little bit confusing, too. A load of the double of the available numer of CPUs is fine. For your system running two CPUs a load of 4 would still be perfect!

/CV

@Christian_Voelker that is really my problem… the server is very slow… and i only say it is cpu related because if you compare the load average with the other server this is always over 1.0 or 2.

Like said before, both servers are out of prodution, so no users, the only difference between then is the hypervisor hardware…

The thing is that using top i’m not able to see who is the responsible for that slow… other think ´s that because of that all the web gui is soo slow that 90% of the time i get timeouts

So what hypervisor are you using? And what is the difference on the hardware? Is there perhaps a high load on the hypervisor itself?

/CV

Both servers have xcp-ng latest versions (7.6)
Both servers have one and the same VM (ucs 4.3-2)
Both vms don’t have prodution (aka don’t have users)

Server ok -> hp dl380 g6 (two cpu Intel Xeon E5450 + 8gb ram)
Server not ok -> hp dl360 g5 (one cpu Intel Xeon 5140 + 6gb ram)
That said the stats from the hypervisor are
G6 host
image
G6 VM
image
G5 host
image
G5 VM
image

PS: samba services still stopped in G5 VM since +/- 8:30
image

@Christian_Voelker here is the output of the low pid samba process right now:


root@MPADC01:~# ls -al /proc/8011/fd/10
lrwx------ 1 root root 64 nov  7 08:26 /proc/8011/fd/10 -> /var/lib/samba/private/sam.ldb
root@MPADC01:~# ls -al /proc/8011/fd/11
lrwx------ 1 root root 64 nov  7 08:26 /proc/8011/fd/11 -> /var/lib/samba/private/sam.ldb.d/CN=SCHEMA,CN=CONFIGURATION,DC=CCM,DC=LOCAL.ldb
root@MPADC01:~# ls -al /proc/8011/fd/12
lrwx------ 1 root root 64 nov  7 08:27 /proc/8011/fd/12 -> /var/lib/samba/private/sam.ldb.d/CN=CONFIGURATION,DC=CCM,DC=LOCAL.ldb
root@MPADC01:~# ls -al /proc/8011/fd/14
lrwx------ 1 root root 64 nov  7 08:27 /proc/8011/fd/14 -> /var/lib/samba/private/sam.ldb.d/DC=DOMAINDNSZONES,DC=CCM,DC=LOCAL.ldb
root@MPADC01:~# ls -al /proc/8011/fd/15
lrwx------ 1 root root 64 nov  7 08:27 /proc/8011/fd/15 -> /var/lib/samba/private/sam.ldb.d/DC=FORESTDNSZONES,DC=CCM,DC=LOCAL.ldb
root@MPADC01:~# ls -al /proc/8011/fd/13
lrwx------ 1 root root 64 nov  7 08:27 /proc/8011/fd/13 -> /var/lib/samba/private/sam.ldb.d/DC=CCM,DC=LOCAL.ldb
Mastodon